FIFO Accurate Inventory Aging Report for Resellers: Flag Top 10 Monthly


Table of Contents
- What data and buckets you need before you start
- The formulas behind an accurate aging report
- Building the report: spreadsheet steps and software settings
- Turning aging buckets into action
- When aging triggers a write-down under IAS 2
- A worked example you can replicate
- Cutting aging time as a multichannel seller
- What I’d actually run every month
- Let Ruit clear your aging buckets faster
- Sources
- FAQ
- Recommended
An inventory aging report groups stock by how long it has sat unsold, so you can see exactly where cash is stuck and act before it turns into a write-off. The report matters because a heavy long-age bucket or a climbing days-sales-of-inventory figure usually means money tied up in goods nobody wants anymore.
TL;DR:
- Long-age inventory buckets, especially over 180 days, indicate substantial cash being trapped in slow-moving stock that may require liquidation or deep discounts.
- Accurate aging reports depend on precise receipt and sale dates, consistent unit costs, FIFO drawdown, and proper bucket ranges tailored to product category turnover rates.
- Using a static snapshot for report export ensures audit accuracy and helps avoid decisions based on shifting real-time inventory data.
- Implementing automated cross-listing tools can maintain accurate stock levels across multiple marketplaces, accelerating turnover of aged inventory.
- Regular monthly reviews of long-standing SKUs and immediate testing of targeted promotions can reduce aging buckets efficiently for faster inventory turnover.
What data and buckets you need before you start
Before you build anything, pull the raw fields that make an aging report accurate rather than a guess dressed up in a spreadsheet.
- SKU identifying the exact item and variant.
- Receipt date, the day the unit entered stock.
- Last sale or issue date, marking the most recent time that unit or lot moved.
- Quantity on hand, counted at the SKU or lot level.
- Unit cost, kept consistent with your valuation method.
- Location or lot, since the same SKU can age differently across warehouses.
Bucket ranges depend on how fast your category turns. A practical aging guide from Shopify uses 0 to 30, 31 to 60, 61 to 90, 91 to 180, and 180-plus days, and recommends tightening those windows for perishable or fashion goods while stretching them for durable products. A grocer might use daily buckets past week two, while an electronics distributor can afford 90-day steps.
Larger operations also need to decide the level of aggregation: per-site, per-warehouse, per-lot, or per-item-group. A retailer with three stores and one central warehouse should run aging separately for each location, since a slow shelf in one store can hide a stockout risk in another.
The formulas behind an accurate aging report
Three calculations sit underneath every aging report. Cost of goods sold (COGS) reflects the cost of units actually sold in the period. Inventory turnover divides COGS by average inventory, showing how many times stock cycles through in a year. Days sales of inventory, or DSI, is calculated as average inventory divided by COGS, multiplied by 365, a formula laid out in detail by Wall Street Prep’s inventory days breakdown.
The harder part is bucket assignment. Receipts get sorted into buckets by receipt date, then reduced as units are issued, and this reduction has to follow FIFO drawdown: the oldest receipts are consumed first. Skip that step and a system might tag units as older or newer than they really are, which throws off markdown timing and write-off decisions built on the report.
| Metric | Formula | What it tells you |
|---|---|---|
| COGS | Beginning inventory + purchases minus ending inventory | Cost of units sold in the period |
| Inventory turnover | COGS ÷ average inventory | How many times stock cycles per year |
| DSI (average inventory age) | (Average inventory ÷ COGS) × 365 | Average days stock sits before selling |
A rising DSI alongside a growing 180-plus-day bucket is the clearest signal that cash is getting trapped in stock that is not moving, based on the aging-and-turnover relationship described in Wall Street Prep’s inventory days guide.
Building the report: spreadsheet steps and software settings
You can build a working aging report in a spreadsheet with three ingredients: a clean receipts ledger, a FIFO drawdown routine, and a pivot summary.
- Normalize your dates so receipt and sale dates use the same format and time zone across every source file.
- Align unit costs to your chosen valuation method (FIFO, weighted average, or standard cost) before any bucket math runs.
- Determine last-sale date per SKU and location, pulling from your point-of-sale or order export rather than a stale master file.
- Build a receipts ledger listing every inbound lot with date, quantity, and cost.
- Run the FIFO drawdown: for each outbound sale, deduct quantity from the oldest remaining receipt row first, tagging what is left with its original receipt date.
- Pivot the tagged rows into your bucket ranges to get a per-bucket quantity and value summary.
For catalogs too large for a spreadsheet, inventory software needs four settings dialed in correctly: the as-of date for the snapshot, the unit of the aging period (days or weeks), the number and width of aging periods, and the view level (SKU, location, or item group). Microsoft’s Dynamics 365 documentation walks through worked examples of how on-hand quantity and value get bucketed this way, and its companion report storage guidance recommends running large datasets into stored report tables rather than live queries, so you can export a stable snapshot for audit.
Pro Tip: Export your bucketed report to a static file the same day you generate it, so auditors see the exact snapshot you acted on, not a live number that has since shifted.

Turning aging buckets into action
Each bucket calls for a different response, and the mistake most teams make is treating every aged unit the same way regardless of how old it actually is.
- 0 to 60 days: monitor only, this is normal turnover for most categories.
- 61 to 90 days: trigger light markdowns or bundle promotions to nudge movement.
- 91 to 180 days: consider transfers to a location with better demand, or deeper discounts.
- 180-plus days: move to liquidation, secondary channels, or a formal write-off review.
Before discounting, estimate the carry cost of holding the unit another month (storage, insurance, capital tied up) against the expected recovery after a markdown. If a 30% price cut still nets more than continued holding costs, the markdown wins. Practical tactics include bundling slow SKUs with fast sellers, listing on secondary channels, running timed flash promotions, and freezing new purchase orders for categories already sitting in the 91-plus bucket for retail pop-up events.
When aging triggers a write-down under IAS 2
Aging data on its own is not an accounting entry, but a heavy long-age bucket is usually the signal that triggers a net realizable value (NRV) test. IAS 2 requires inventories to be measured at the lower of cost and net realizable value, meaning that once expected selling price minus remaining costs to sell falls below cost, you write the inventory down.
Inventories should be measured at the lower of cost and net realizable value, and a write-down is reversed only up to the amount of the original write-down when circumstances that previously caused it no longer exist. IAS 2, IFRS Foundation
For finance and audit purposes, keep the aging report and the NRV assessment side by side: the same SKU list, the same date, the same bucket assignments, with a note on which SKUs prompted a write-down and why.
A worked example you can replicate
Say a SKU has two receipts: 50 units on January 1 at $10 each, and 40 units on February 15 at $12 each. By March 1, 60 units have sold. Under FIFO drawdown, the sale consumes all 50 units from the January receipt first, then 10 units from the February receipt, leaving 30 units from February still on hand.
| Receipt date | Original qty | Unit cost | Remaining after sale | Age bucket (as of March 1) |
|---|---|---|---|---|
| January 1 | 50 | $10 | 0 | (fully consumed) |
| February 15 | 40 | $12 | 30 | 0-30 days |
Without FIFO drawdown, a naive system might just subtract 60 from the combined 90 units and assign the remaining 30 units to whichever receipt date it defaults to, potentially mislabeling them as January stock and triggering an unnecessary write-down review. Two quick checks on your own data: confirm that total remaining quantity across buckets equals your current on-hand count, and confirm that no bucket contains more units than that receipt originally held.
| Check | What it confirms |
|---|---|
| Sum of bucketed quantities | Matches total on-hand quantity exactly |
| Units per bucket vs. original receipt | Never exceeds the original receipt quantity |
Cutting aging time as a multichannel seller
Sellers moving second-hand goods across several marketplaces face a specific version of this problem: the same item can look “aged” on one platform while it is actually just poorly exposed. A cross-listing tool can address that by syncing inventory and automating relists across marketplaces like Wallapop, Vinted, and eBay from one dashboard.
- Inventory sync keeps quantity accurate across every marketplace, so an aging report built from a single export reflects true stock, not stale listings.
- Automated relisting and price suggestions push aging items back to the top of search results and adjust pricing without manual work on each platform.
- Scheduled posting spreads listings so slow-moving stock gets renewed exposure instead of sitting untouched in one channel.
What I’d actually run every month
I run aging monthly and flag the top ten SKUs by value sitting in the longest bucket. The habit that works best: pair that monthly check with one triggered promotion, a markdown or bundle, tested immediately rather than left for next quarter.
- Luis
Let Ruit clear your aging buckets faster
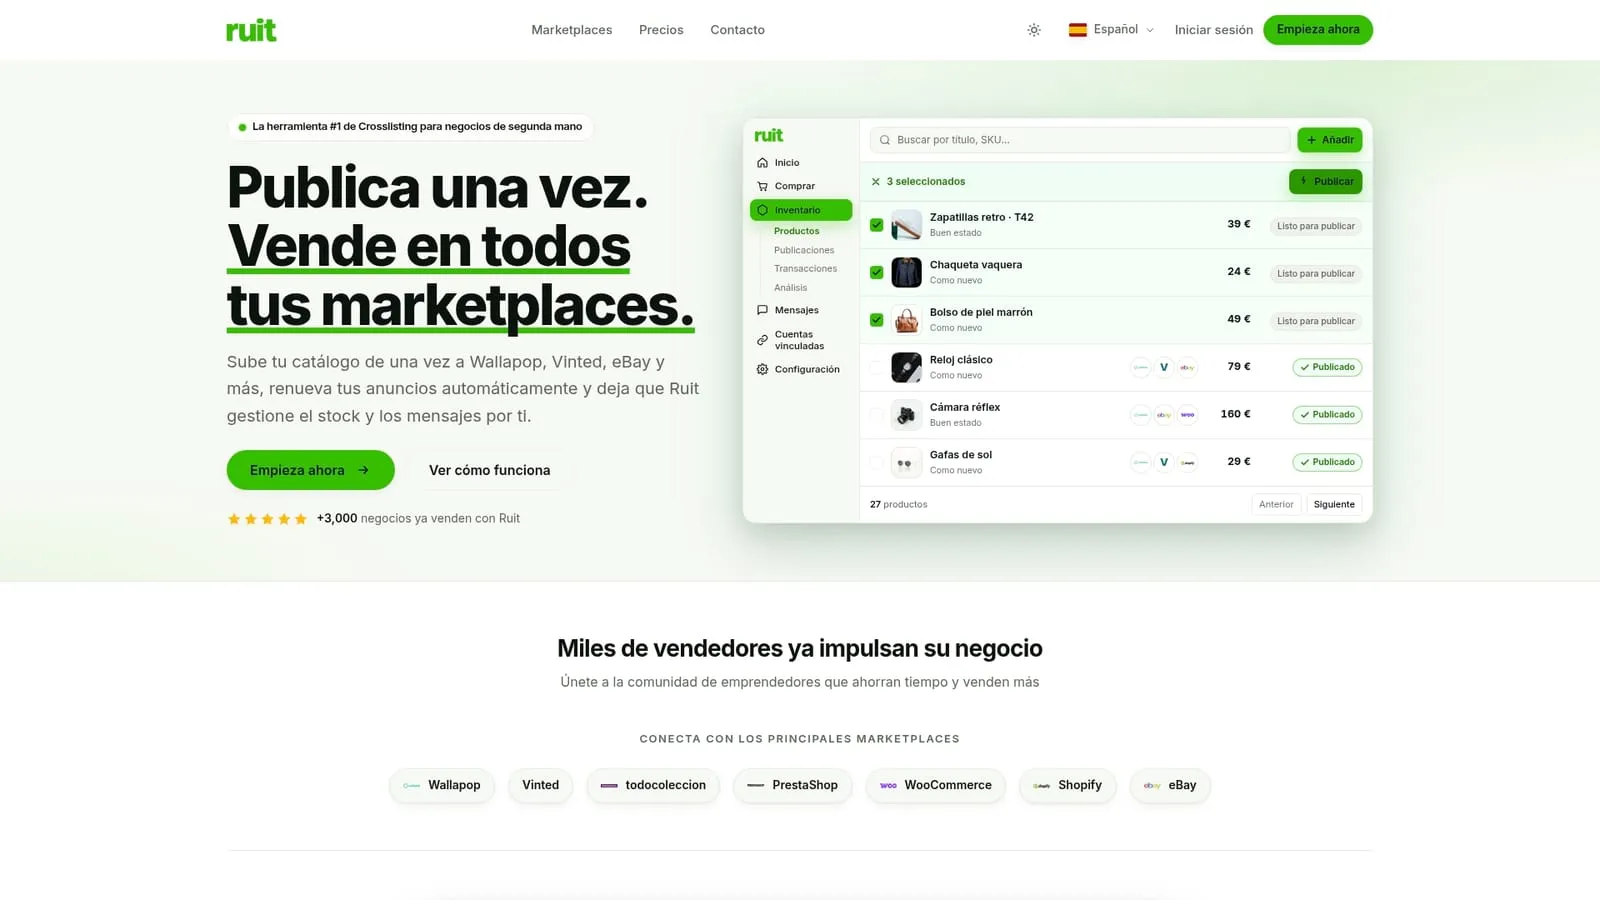
Every action in this report, markdowns, transfers, faster listing turnover, gets easier when your stock and pricing update automatically across every marketplace instead of one at a time. Ruit’s cross-listing and inventory sync are built for exactly that, on its paid plans.
Check current pricing and plan details to see which tier fits your catalog size.
Sources
- Inventory aging report examples and logic - Supply Chain Management | Dynamics 365 | Microsoft Learn
- Inventory aging report: what it is & how to use it - Shopify
- Inventory Days | Formula + Calculator - Wall Street Prep
FAQ
What is the aging report of inventory?
An inventory aging report groups stock on hand by how long it has been sitting unsold, typically in buckets like 0 to 30, 31 to 60, and 180-plus days. It helps you spot slow-moving or obsolete stock before it becomes a financial write-off.
How do you calculate the aging of inventory?
You sort receipts by date, then reduce quantities using FIFO drawdown as units sell, so the oldest stock is consumed first in the calculation. The remaining quantity per receipt is then placed into its corresponding age bucket based on days since receipt.
What does an inventory aging report look like?
It typically appears as a table with SKU, location, and a column for each age bucket showing quantity and value, similar to the worked examples in Microsoft’s Dynamics 365 documentation. Some reports add a total row and a percentage-of-total-value column per bucket.
How do you create an inventory aging report?
Start with a clean receipts ledger containing SKU, date, quantity, and cost, then run a FIFO drawdown against sales before pivoting the results into your chosen bucket ranges. For larger catalogs, inventory software with as-of date and aging period settings, as described in Microsoft’s report storage guidance, handles this automatically.