8 Sales Analysis Report Examples for Sellers

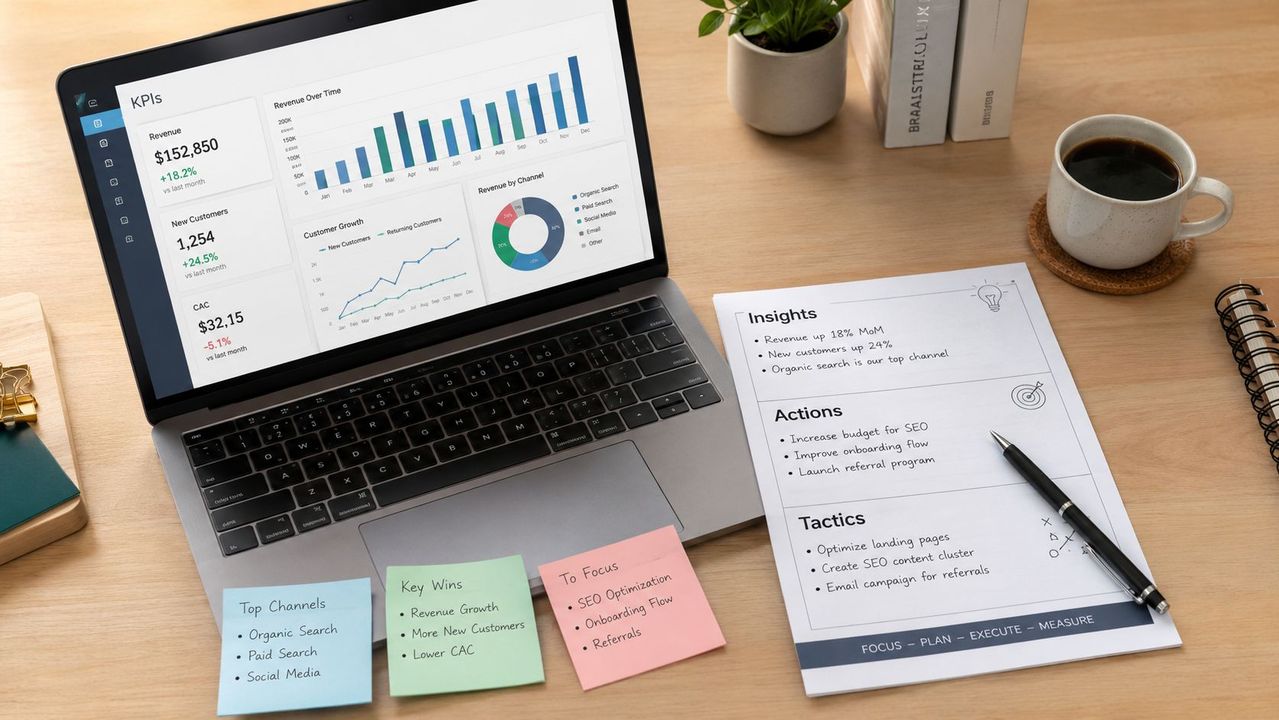
Table of Contents
- Table of Contents
- 1. Multichannel Sales Analysis Dashboard
- 2. Product Profitability Analysis
- 3. Marketplace Performance Report
- 4. Demand and Inventory Trend Analysis
- 5. Productivity and Operational Efficiency Report
- 6. Customer Behavior and Conversion Analysis
- 7. Dynamic Pricing and Competitiveness Report
- 8. Business Growth and Milestone Report
- Comparison of 8 Sales Analysis Reports
- Turn the Example Into a Weekly Decision System
You’re selling across Wallapop, Vinted, eBay, and perhaps your own shop. The transactions are happening, but the answers aren’t obvious. Which channel deserves more inventory? Which products create profit after fees and freight? Is a slow listing overpriced, poorly presented, or in the wrong marketplace? A spreadsheet full of sales rows rarely resolves those questions on its own.
A useful sales analysis report example connects clean data to a specific decision. It should show clear KPIs, comparable periods, readable charts, export-ready fields, and a defined action attached to every important metric. Sales analysis normally starts with historical transaction data such as quantity sold, revenue, cost of goods sold, and gross profit, then segments those measures by customer, product, or channel. Sage’s own customer sales history report documentation describes reporting on exactly those measures by customer.
The eight examples below move from visibility and profitability to marketplace allocation, demand, operations, customers, pricing, and growth. Use Oviond’s ecommerce reporting tools as a useful companion, then connect each report to the next action. For professional second-hand businesses, Ruit can centralize the underlying sourcing, inventory, listing, and order data so those decisions don’t depend on disconnected exports.
Table of Contents
- 1. Multichannel Sales Analysis Dashboard
- 2. Product Profitability Analysis
- 3. Marketplace Performance Report
- 4. Demand and Inventory Trend Analysis
- 5. Productivity and Operational Efficiency Report
- 6. Customer Behavior and Conversion Analysis
- 7. Dynamic Pricing and Competitiveness Report
- 8. Business Growth and Milestone Report
- Comparison of 8 Sales Analysis Reports
- Turn the Example Into a Weekly Decision System
1. Multichannel Sales Analysis Dashboard
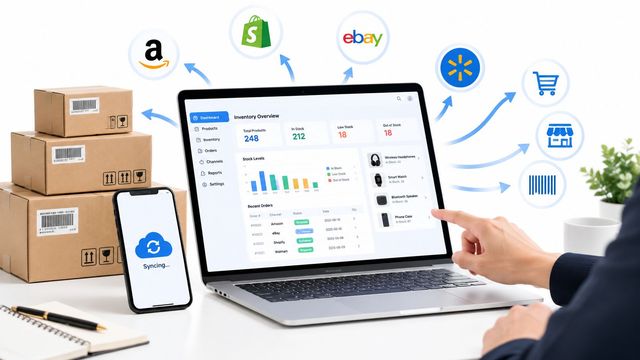
A seller checks three marketplaces before deciding where to place the next batch of inventory. One channel shows high revenue, another has more completed orders, and a third holds many active listings with little movement. A multichannel dashboard turns that comparison into an allocation decision by displaying revenue, completed sales, average sale price, profit, inventory position, and product performance by channel. The important design choice is selecting the small group of metrics that explains whether a channel produces useful business, rather than tracking activity.
A practical export should retain the marketplace name, order ID, invoice date, product ID, quantity, sale price, fees, freight, cost, and calculated margin. These fields make the dashboard auditable and allow consistent period comparisons. Oracle’s historical sales analysis documentation describes daily, weekly, monthly, quarterly, and yearly comparisons across dimensions such as region, item, and order history. A small seller can apply the same structure if date ranges and metric definitions stay consistent.
Read the dashboard as an allocation tool
Use a line chart for revenue and profit across comparable periods, a stacked bar chart for channel contribution, and a ranked table for products requiring action. The comparison may show that Vinted generates strong revenue from a small share of available stock, while another marketplace carries many listings but creates little contribution. That result supports investigation before stock is moved. Category fit, listing quality, buyer intent, or shipping friction may explain the difference.
Decision rule: Every alert should identify an owner and an action, such as checking a listing, reallocating stock, reviewing a fee, or investigating a missing order.
Review the dashboard often enough to catch operational issues, while treating short-term fluctuations cautiously. Compare like with like and record unusual events. The next action should be visible beside the metric, so a change in channel performance leads directly to a defined check, test, or inventory decision.
2. Product Profitability Analysis
A second-hand seller can see two items reach similar sale prices while one produces far less value after costs and work. A profitability report exposes that gap by accounting for purchase cost, marketplace commissions, listing expenses, shipping, refunds, packaging, and labor for sourcing, photographing, describing, answering questions, and dispatching. Labor deserves its own line because preparation time can differ sharply between comparable products.
Build the report from one row per completed transaction or product line. Record purchase cost, sale price, platform fees, payment costs, freight, other direct expenses, labor time, gross margin, and net contribution. Keep gross and net measures separate. A product may show an attractive gross margin yet consume excessive handling time or generate repeated shipping exceptions.
Use margin to change the assortment
A scatter plot can place sale price on one axis and net contribution on the other, with bubble size representing labor time. This separates expensive products from products that create stronger economic value. Follow it with a ranked table that flags items below the business’s minimum acceptable margin, products with repeated returns, and listings whose shipping cost is disproportionate to their selling price.
The strategic question goes beyond which products sell. It is which products deserve more sourcing effort? A low-priced item may justify continued sourcing if it turns quickly and needs little preparation. A premium item may require a higher price, a better channel, or a lower sourcing cost before it becomes worthwhile. Use this guide to finding a selling price when the report indicates that the current price does not cover the full cost structure.
The next action should follow the margin finding: source more of efficient products, revise pricing for under-contributing items, or stop buying products that remain weak after reasonable changes.
Review the report on a regular schedule, and investigate major changes sooner. Marketplace fee updates, carrier rate changes, and added category preparation can alter contribution quickly. The analysis can mislead when costs are incomplete, returns are omitted, or unpaid personal time is treated as free. A margin threshold only supports sound assortment decisions when it reflects the work required to complete each sale.
3. Marketplace Performance Report
A marketplace report compares channels using more than sales volume. Its purpose is to answer where should the next batch of inventory go? Useful dimensions include completed sales, revenue, average sale price, net margin, time to sale, cancellations, returns, buyer messages, and benefit per hour worked. The exact definitions must remain stable, otherwise one platform may appear stronger only because its data is recorded differently.
A compact comparison view works well here. Put marketplaces in rows and decision metrics in columns, then add a time-series chart for revenue and net contribution. Use a separate inventory view showing how many active listings sit on each channel and which categories each channel carries. The result should make imbalance visible without implying that the largest sales count is automatically the best outcome.
Separate demand from channel economics
A seller may find that one marketplace sells more units, while another sells fewer units at better contribution. That trade-off affects replenishment, listing effort, customer service, and cash tied up in inventory. A slower channel isn’t necessarily weak if its margin and product fit compensate for the waiting period. Conversely, a high-volume channel can become unattractive if fees, returns, or manual work consume the contribution.
“Move inventory gradually, then measure the result against the same product and period definitions.”
Use a rolling historical view rather than reacting to a single week. Seasonality, category mix, platform search visibility, and shipping options can all distort the comparison. The report should therefore preserve product category and condition, not just marketplace totals.
Centralized order data makes these comparisons easier to maintain. Cloud-based order management for multichannel sellers explains the operational value of working from connected order information instead of rebuilding the same view from separate marketplace files. The next action might be a controlled inventory shift, a listing-quality review, or a test of a different category on the weaker channel. Record the decision before changing allocation, or you won’t know what caused the result.
4. Demand and Inventory Trend Analysis
A demand report connects sales history with the stock decisions that happen before a sale. It answers what should we source, replenish, hold, bundle, or stop buying? The core dataset should combine product attributes, purchase date, listing date, sale date, current stock status, condition, brand, category, asking price, final price, and sales channel.
Use a time-series chart for units sold and a separate inventory-age view for unsold products. A heatmap by category and period can reveal recurring demand patterns, while a ranked table can separate fast-moving stock from items that remain listed without meaningful buyer response. Oracle’s historical analysis model supports comparisons across time and product dimensions, which is the foundation for this type of report: demand needs continuity, not a snapshot.
Treat predictions as prompts, not proof
A seller of vintage electronics might notice that a particular camera type receives stronger demand during a recurring seasonal period. That observation can inform sourcing, but it shouldn’t become an automatic buying rule. Historical demand may reflect an unusual promotion, a temporary trend, a one-off scarce item, or a change in marketplace visibility.
A forecasting layer can help prioritize attention, especially when it combines sales history with product features such as brand, model, year, condition, and category. External context, including search interest or social activity, can add interpretation, but it shouldn’t replace transaction evidence. The report should show the assumptions behind any prediction and distinguish observed sales from projected demand.
The operational action is specific: source more of a defined product profile, adjust the target purchase cost, move aging inventory to another channel, or stop acquiring a weak category. Inventory analytics becomes more useful when it includes stockouts, sell-through, turnover, and gross margin by product or channel. A retail analytics case study from Numlytics describes this multidimensional structure and reports gains from redistribution, targeted promotions, and reduced excess stock. Those results are a benchmark pattern, not a promise for every seller.
5. Productivity and Operational Efficiency Report
A sale can look profitable until the seller measures the work behind it. An efficiency report assigns time to sourcing, photography, listing creation, buyer communication, packing, dispatch, returns, and administration. It then compares that time with revenue, margin, and completed sales. The strategic question becomes which workflow deserves simplification before the business adds more inventory?
Begin with a task log connected to product and order IDs. Record the task, person responsible, start and finish time, product category, channel, and outcome. A weekly summary can show total hours by activity, while a product-level view can calculate contribution per hour. Avoid treating every minute as perfectly precise. Consistent estimates are more useful than occasional guesses, as long as the method is applied in the same way.
Find bottlenecks with a process view
A bar chart can rank tasks by time consumed. A second chart can compare each task’s time share with its contribution to sales or profit. If photography consumes substantial attention but doesn’t improve the economics of the listing, the answer might be a standard photo workflow, batch editing, or a narrower image requirement. If buyer messages dominate the day, saved responses, clearer descriptions, or better product specifications may reduce avoidable conversations.
The report can mislead when sellers count only visible tasks. Searching for stock, correcting inventory errors, chasing missing parcels, and handling cancellations also consume capacity. Include those activities or the calculated benefit per hour will be overstated.
Practical rule: Automate the repetitive task only after you know its frequency, time cost, error rate, and effect on the buyer experience.
The next action should be a small process change with a measurable owner. Standardize a listing template, batch a task, remove duplicate entry, or test an automated response flow. Then compare the same productivity measures after the change. Efficiency isn’t about doing everything faster. It’s about preserving margin while the team handles more valuable work.
6. Customer Behavior and Conversion Analysis
A customer conversion report follows the path from listing exposure to completed order. For marketplace sellers, the available signals may include views, saves, clicks, questions, offers, response time, and purchases. The report answers why are buyers stopping before checkout, and which listing change should we test first?
Organize the data at listing level. Include product ID, channel, title version, photo set, description attributes, price history, time active, buyer interactions, and order outcome. A funnel chart can show movement from visibility to inquiry to purchase. A listing matrix can then compare products with high attention but weak conversion against products with lower attention but stronger purchase behavior.
Diagnose the right failure point
High visibility with low conversion often points to a mismatch between the promise and the offer. The cause might be price, condition detail, missing measurements, weak photography, unclear shipping terms, or slow replies. Low visibility requires a different response, such as improving the title, category, attributes, or channel placement. Treating both problems as “the listing needs optimization” wastes time because the actions differ.
A strong example is a second-hand phone listing that receives questions about battery health, storage, and cosmetic condition. If those details are missing, adding them may reduce uncertainty. But the report should compare listings with similar product types and channels. Different categories attract different buyer behavior, so broad averages can produce misleading conclusions.
Run controlled listing tests rather than changing title, photos, and price simultaneously. Keep a record of what changed and when, then evaluate completed sales and net contribution, not attention alone. Conversion is useful only when it leads to profitable orders.
The report also needs careful data hygiene. A view may not represent a unique buyer, an inquiry may come from a returning customer, and a sale may be attributed to a listing after the buyer interacted through another route. Use the available signals as directional evidence, then validate the decision with order and margin data.
7. Dynamic Pricing and Competitiveness Report
A slow-moving item may need a price change, but the right response depends on margin, product differences, and buyer activity. This report answers should this item be repriced, held, bundled, moved to another channel, or left alone? Compare more than headline price. Condition, completeness, brand, model, shipping, seller reputation, photography, return terms, and time listed can all influence the buyer’s choice.
Build a product-level record with current price, historical changes, channel, comparable offers, fees, shipping cost, purchase cost, and net contribution. A range chart can place your price beside comparable listings, while a second line marks the minimum profitable price. That structure helps marketplace sellers and small shops distinguish competitive pressure from an acceptable pricing decision.
Price for the decision, not the ranking
A lower price may improve the movement of a slow item, yet the change succeeds only if it supports profitable sales. Show its effect on net margin, time to sale, and labor required. Comparable listings also need matching condition and accessories. Without those controls, an apparent price gap may reflect a different offer rather than a pricing opportunity.
Scarcity, stronger documentation, or better presentation can justify a higher price. Matching a cheaper competitor may then reduce margin without increasing demand. Use analytics to protect your margins as a reminder that price monitoring must serve unit economics and support judgment rather than replace it.
Set review rules using time listed, buyer activity, stock age, and margin floor. Apply gradual changes and record the reason, such as weak conversion, excess stock, a new comparable listing, or changed shipping cost. The next action may be a revised title or better photos instead of a discount. Pricing remains one lever among several, so the report should connect price with presentation and offer quality before recommending a cut.
8. Business Growth and Milestone Report
A growth report shows whether the business is becoming more valuable to operate, not merely larger in visible activity. Track revenue, completed sales, profit, active inventory, channel count, listing output, inventory age, repeat customers, and benefit per hour across consistent periods. The strategic question is which changes created durable improvement, and what should the business plan next?
A useful report combines a historical line chart with an annotated event log. Mark the launch of a new marketplace, a sourcing change, a pricing policy, a process redesign, or a major catalog expansion. Without that context, a rising or falling line invites unsupported explanations. With it, the owner can investigate whether the timing of a strategic change corresponds with a change in sales, margin, workload, or stock health.
Growth needs quality controls
A business can increase listings while weakening cash efficiency. It can raise revenue while reducing profit. It can add channels while creating more duplicated work and stock errors. That’s why the report should place scale measures beside contribution measures, including net margin and benefit per hour.
Use quarterly planning to review which initiatives produced useful results and which created complexity without sufficient return. A marketplace expansion may improve reach but dilute operational focus. More inventory may increase choice but also increase unsold stock and capital tied up in products. Growth isn’t a single upward line, it’s a trade-off between demand, economics, capacity, and control.
Keep milestone definitions explicit. “Expanded inventory” should specify what counts as active, available, or sellable. “Improved performance” should identify the relevant KPI and period comparison. Historical sales analysis depends on consistent period-over-period structure, as the Oracle historical sales analysis reference illustrates. The next action might be a focused channel test, a sourcing target, a hiring decision, or a process investment tied to the constraint the report reveals.
Comparison of 8 Sales Analysis Reports
| Report | 🔄 Implementation Complexity | ⚡ Resource Requirements | ⭐ Expected Outcomes / 📊 Impact | Ideal Use Cases | 💡 Key Advantages |
|---|---|---|---|---|---|
| Multichannel Sales Analysis Dashboard | Medium to High: many marketplace integrations & real-time sync | APIs + data pipeline, moderate dev & maintenance | High ⭐: unified visibility; faster channel decisions; time saved 📊 | Multi-platform sellers with large SKUs | Centralized view; anomaly alerts; saves hours |
| Product Margin Analysis (Profitability by SKU) | Medium: cost mapping and accounting integration | Accurate cost inputs, accounting sync, SKU-level data | High ⭐: reveals true profitability; better pricing decisions 📊 | Sellers needing SKU-level profit clarity | Identifies toxic SKUs; automates margin calc |
| Marketplace Performance Report | Medium: cross-platform comparisons, requires volume | Historical sales per marketplace, comparative metrics | Medium to High ⭐: optimizes inventory allocation and channel strategy 📊 | Decide where to list or invest resources by channel | Highlights most profitable/fast channels |
| Demand & Inventory Trends (Forecasting) | High: requires ML models and historical data | Large historical dataset, ML/IA expertise | High ⭐: demand forecasts; fewer dead-stock; smarter sourcing 📊 | Sourcing teams; inventory planners; seasonal products | Predictive sourcing; reduces inventory waste |
| Productivity & Operational Efficiency Report | Medium: time-tracking + activity attribution | Time-tracking tools, process logging, team discipline | High ⭐: improves profit/hour; identifies automation wins 📊 | Operations optimization; scaling teams | Reveals time sinks; justifies automation spend |
| Customer Behavior & Conversion Analysis | Medium: tracking funnel metrics & A/B tests | Traffic/impression data, A/B testing tools, sufficient traffic | High ⭐: increases conversion rate without extra ad spend 📊 | Improve listings (titles, photos, descriptions) | Identifies what drives conversions; A/B insights |
| Dynamic Pricing & Competitiveness Report | High: continuous competitor monitoring & rules engine | Price scraping, repricing engine, rule configuration | Medium to High ⭐: better rotation & competitiveness while protecting margin 📊 | Competitive categories; price-sensitive items | Fast repricing; protects margins with guardrails |
| Growth & Business Milestones Report | Low to Medium: BI & longitudinal tracking | Historical sales data, BI/dashboard tool | Medium ⭐: strategic view of growth, supports forecasting 📊 | Strategic planning, investor reporting, KPI tracking | Shows long-term trends; benchmarks and milestones |
Turn the Example Into a Weekly Decision System
Eight separate reports won’t improve a business if nobody uses them to make decisions. Build a rhythm around the question each report answers. Review the multichannel dashboard and marketplace report for channel allocation. Use profitability and pricing analysis for product-level decisions. Use demand and inventory analysis for sourcing and stock movement. Review productivity for workflow changes, conversion for listing experiments, and growth for broader planning.
A practical weekly meeting can stay concise if each report has one owner and one decision. The owner explains the relevant change, identifies the likely cause, and recommends the next action. The team then records the decision, expected effect, review date, and data needed to evaluate it. This prevents a dashboard from becoming a passive display that everyone checks but nobody acts on.
Validate the reporting foundation
Before trusting a result, check the export and its definitions:
- Confirm transaction scope: Separate completed sales from cancelled orders, returns, unpaid orders, and draft listings.
- Standardize dates: Use the same invoice, order, or completed-sale date consistently across periods.
- Reconcile channels: Check that marketplace totals match the underlying order records and that duplicate imports are removed.
- Assign KPI owners: Give each metric a person responsible for reviewing changes and proposing action.
- Document assumptions: Record how fees, freight, labor, returns, discounts, and taxes enter the calculation.
- Compare consistently: Use comparable periods and preserve the same product, channel, and condition filters.
The data can mislead when one report uses listing date and another uses sale date, when labor is omitted from product economics, or when channel totals mix gross revenue with net proceeds. Standardized fields such as quantity, revenue, cost of goods sold, and gross profit support more reliable comparisons, as described in Sage’s customer sales history report documentation.
The best sales analysis report example isn’t the most elaborate dashboard. It’s the one that connects a metric to a profitable action, exposes the trade-off behind that action, and makes the result easy to revisit. Ruit can provide a centralized data foundation for professional second-hand sellers managing sourcing, inventory, listings, and orders, rather than leaving each decision scattered across marketplace exports.
Ruit centralizes sourcing, inventory, multichannel listings, prices, messages, and orders for professional second-hand businesses. Visit Ruit to see whether one operational data foundation fits your workflow.