30 Day Sell Through Rate Test for Multichannel Sellers


Table of Contents
- What Sell-Through Rate Actually Measures
- The Sell-Through Rate Formula (With a Real Example)
- What Counts as a Good Sell-Through Rate
- How to Improve Sell-Through Rate: A Practical Playbook
- How Often You Should Track Sell-Through Rate
- Sell-Through Rate vs. Inventory Turnover
- Cross-Listing and Automation as a Sell-Through Lever
- Your 30-Day Sell-Through Test Plan
- A Simpler Way to Keep Sell-Through Rate Moving in the Right Direction
- Sources
- FAQ
- Recommended
Sell-through rate measures the percentage of inventory you actually sold during a set period, calculated against what you had available to sell. It matters because a low number means cash is sitting on shelves instead of in your bank account, and a number that’s too high can mean you’re losing sales to stockouts. Most retailers should start by checking it monthly, then adjust cadence based on what the number tells them.
TL;DR:
- A sell-through rate below 20% indicates overstock, while rates above 80% often signal stockout risks rather than success.
- Calculating sell-through rate requires units sold divided by the sum of beginning inventory and units received, expressed as a percentage, with the appropriate time window critical for accuracy.
- Weekly tracking is recommended during product launches or promotions, but monthly reporting suffices for most regular inventory management.
- Cross-listing across multiple marketplaces and automating inventory updates can significantly improve sell-through by increasing listing visibility and reducing stale stock.
- Replenishment lead times influence what is considered a healthy sell-through rate, with longer lead times requiring higher rates to prevent stockouts.
What Sell-Through Rate Actually Measures
Sell-through rate goes by a few names depending on who you ask: sell-thru, STR, or sell-through ratio. They all point to the same thing. This isn’t a vanity metric for a dashboard nobody looks at. It’s the number that tells you whether a product is earning its shelf space or your marketplace listing fee.
STR works best at the SKU level, not as a store-wide average that hides your problems. It’s the cleanest signal of whether a specific product is pulling its weight, which makes it the go-to metric for a few specific jobs:
- Deciding whether a new product launch is catching on or falling flat
- Monitoring a promotion in real time instead of waiting for the post-mortem
- Comparing performance across sales channels when you list the same item in multiple places
The catch: sell-through rate is timing sensitive. A SKU that received a big restocking five days ago will show a lower rate than one that’s been sitting for six weeks, even if daily sales are identical. STR also won’t tell you why something isn’t selling. It flags the symptom. Price, photos, seasonality, or a competitor’s listing could all be the actual cause, and you’ll need to dig separately to find out which.
The Sell-Through Rate Formula (With a Real Example)
The formula is simple enough to run in your head, but the inputs trip people up more often than the math does.
- Start with units sold. Total the number of units sold during your chosen period.
- Add beginning inventory and units received. This is what you had on hand at the start, plus any restock that arrived during the period.
- Divide and multiply by 100. The formula is: Sell-Through Rate (%) = (Units Sold / (Beginning Inventory + Units Received)) × 100.
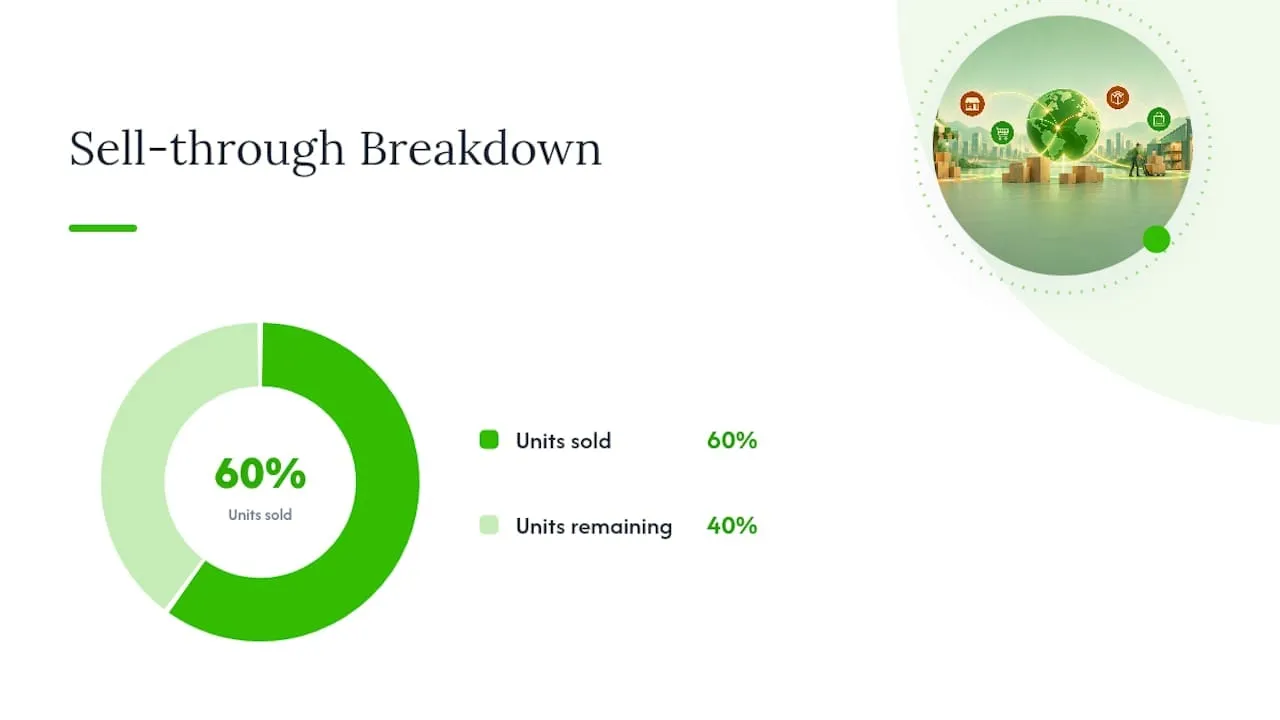
Here’s a worked example. Say you started the month with 200 units of a jacket in stock, received another 100 units mid-month, and sold 180 units by month’s end. That’s 180 divided by 300 (200 plus 100), giving you 0.6, or a 60% sell-through rate.
Picking your time window matters as much as the math. A weekly window suits fast-moving items where a single viral post can swing demand overnight. A 30, 60, or 90-day window works better for seasonal goods or anything with slower, trend-driven demand, since a short window can make a temporary dip look like a crisis when it’s really just a normal lull.
What Counts as a Good Sell-Through Rate
There’s no single magic number, but industry guidance gives you real ranges to work from. Anything under 20% usually signals overstock. A range of 40% to 60% is generally considered solid for most retail categories. Climb to 60% to 80% and you’re looking at strong, healthy velocity. Push past 80% and you’ve crossed into territory that often points to stockout risk rather than pure success.
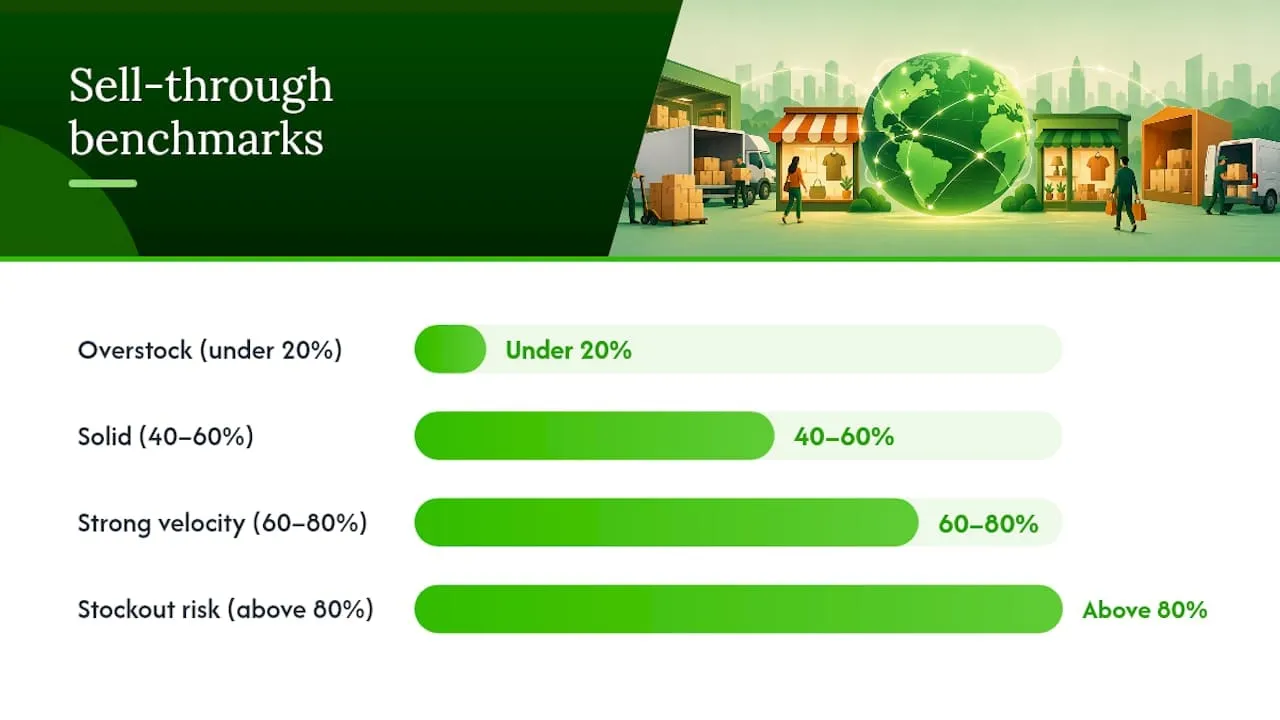
Sell-through rates commonly fall in the 40% to 80% range for healthy inventory management, with figures above 80% frequently flagging undersupply rather than a win.
Those ranges aren’t fixed law, though. Replenishment lead time changes what “good” looks like. If your supplier takes 12 weeks to restock, you need a higher observed sell-through rate before reordering just to avoid a gap on the shelf. If you can reorder in three days, you can run leaner and still stay safe.
A few quick reads on your number:
- Consistently under 20%: you likely overbought, misjudged demand, or priced wrong
- Sitting near 90% for several periods in a row: you’re probably leaving money on the table through missed sales
- Bouncing wildly between periods: check your restock timing before you touch pricing
How to Improve Sell-Through Rate: A Practical Playbook
Boosting sell-through rarely comes down to one lever. It’s usually a combination of buying smarter, pricing sharper, and cleaning up how products actually appear to buyers.
On the buying side, test smaller initial orders on new products instead of betting big upfront. Shortening lead times where your supplier allows it means you can react to real demand instead of guessing six months out.
Pricing and promotion timing matters just as much:
- Mark down early on items showing weak week-one velocity rather than waiting for a clearance event
- Bundle slow movers with popular items to move both at once
- Sequence promotions so you’re not discounting everything simultaneously and training buyers to wait
Merchandising fixes are often the cheapest wins available. Better photos, clearer titles, and cross-listing the same item across multiple marketplaces all increase the number of eyeballs on a listing without spending on ads.
On the operations side, revisit your reorder points and safety stock levels every quarter, not once a year. A reorder rule set for last year’s demand pattern will keep failing you in predictable ways.
Pro Tip: Before you mark anything down, check the margin per unit. A high sell-through rate on a low-margin SKU can look like a win on your dashboard while quietly hurting your actual profit.
The decision rule worth memorizing: mark down when the problem is a single slow-moving batch you need off the shelf now. Reduce future order quantities when the problem is a pattern across multiple cycles. Confusing the two leads to either panic discounting on stock that would’ve sold anyway, or repeating the same overbuying mistake next season.
How Often You Should Track Sell-Through Rate
Monthly is the right baseline for most catalogs. It gives you enough data to see a real trend without reacting to daily noise, and it lines up with how most retailers already review purchasing decisions.
High-velocity SKUs need tighter tracking. Switch to weekly during a launch window or an active promotion, since a problem that takes a month to surface at the standard cadence could cost you real revenue if you don’t catch it in week one.
A few habits make sell-through analysis more useful once it’s part of your regular reporting:
- Always compare like periods: this month against the same month last year, not against a random slow week
- Bracket promotions with a before-and-after comparison so you know the promotion actually moved units, not just revenue
- Pair sell-through numbers with revenue, unit count, and margin before making a reorder call, since sell-through alone won’t tell you if the units you moved were profitable
Sell-Through Rate vs. Inventory Turnover
Inventory turnover measures how many times you sell through and replace your entire stock over a year. Sell-through rate measures what fraction of a specific batch sold in a shorter window. They answer different questions.
Use sell-through rate when you’re making a call on one SKU right now: should you reorder this jacket, or mark it down? Use turnover when you’re looking at your operation as a whole: is your overall inventory strategy efficient, or is cash sitting idle across the board?
Cross-Listing and Automation as a Sell-Through Lever
For second-hand sellers, one of the most direct ways to raise sell-through is simply getting more eyes on each listing without duplicating the work. Cross-listing the same item across multiple marketplaces multiplies exposure and shortens the time an item sits unsold.
Keeping inventory synced matters just as much. A listing that goes stale or drops in search rankings because a renewal was missed loses impressions it can’t get back, and that shows up directly in a lower sell-through number.
- Cross-listing increases the pool of potential buyers seeing each item
- Automated renewals prevent listings from losing visibility over time
- Synced inventory across channels avoids selling the same item twice and having to cancel one order
Tools built for this, like ecommerce inventory management software, exist specifically to close this gap for sellers managing more than one channel at once.
Your 30-Day Sell-Through Test Plan
Pick three SKUs this week and calculate their baseline sell-through rate using last month’s numbers. Run one change per SKU, a price adjustment, a new photo set, or a cross-listing to a second marketplace, and track weekly instead of waiting for month-end. By week four, you’ll have real velocity data to decide whether your next order should get bigger, smaller, or stay the same.
That’s the whole exercise. No spreadsheet template required, just three products, one variable each, and four weeks of honest tracking.
- Luis
A Simpler Way to Keep Sell-Through Rate Moving in the Right Direction
Every tactic above works, but they all take time, and time is the resource most second-hand sellers running multiple marketplaces don’t have. Ruit was built specifically for that problem: one upload publishes your catalog across Wallapop, Vinted, eBay, and other marketplaces at once, instead of you manually recreating listings on each one.
The AI-generated listing text and inventory sync handle two of the biggest sell-through killers directly: stale listings that lose visibility, and stock discrepancies that create canceled orders and frustrated buyers. Many businesses use tools to manage cross-listing and automated renewals, freeing up the hours that used to go into republishing the same item multiple times. If you’re a multichannel seller trying to raise velocity without adding headcount, check the Premium plan at €39 per month, excluding VAT, and see whether the automation earns its keep on your own numbers.
Sources
- Sell-Through Rate: What It Is & How to Calculate It - Sales
- Understanding Sell-Through Rate | The Supply Chain Source
- Sell Through Rate: Definition, Formula, and Importance
FAQ
What Is a Good Sell-Through Rate?
A healthy monthly sell-through rate generally falls between 40% and 80%.
What Is the Sell-Through Rate Formula?
Sell-through rate equals units sold divided by the sum of beginning inventory plus units received, multiplied by 100. The full formula is: (Units Sold / (Beginning Inventory + Units Received)) × 100.
What Does “Sell-Thru Rate” Mean?
“Sell-thru rate” is just an informal spelling of sell-through rate, the same metric measuring what percentage of available inventory sold in a given period. Sellers and analysts use both spellings interchangeably in reports and marketplace dashboards.
Where Can I See My eBay Sell-Through Rate?
Marketplaces like eBay provide seller dashboards, such as Seller Hub, with velocity indicators that reflect how quickly listings are converting to sales. Sellers managing inventory across eBay and other channels often pull these numbers into a separate spreadsheet or inventory tool to compare performance side by side.
How Often Should I Calculate Sell-Through Rate?
Monthly works as a baseline for most product catalogs and purchasing cycles. Switch to weekly tracking for high-velocity SKUs, new launches, or active promotions, since a monthly view can hide a problem that’s already costing you sales.