Avoid HMRC Surprises Above £1,000: Vinted Analytics for UK Sellers


Table of Contents
- What seller metrics does Vinted show you?
- How to export your Vinted data and align it with the tax year
- Key KPIs every seller should track
- Turning metrics into listing fixes
- Tax and reporting: what platform data means for HMRC
- How Vinted’s algorithm uses your analytics
- Benchmarking your numbers against typical seller performance
- Common mistakes when reading Vinted analytics
- Third-party tools that extend what Vinted shows you
- Why seller-level analytics beat platform-wide stats for your business
- How Ruit helps sellers turn Vinted analytics into action
- FAQ
Vinted analytics means the seller-facing data inside your account: views, favourites, conversion and sales history for each listing, not any company-wide or market-wide figures about the platform. The first thing to do with it is open your Vinted seller stats and export your recent transactions, because those records matter for pricing decisions and for UK tax reporting once you cross certain thresholds.
TL;DR:
- Most seller-focused Vinted data depends on listing-specific metrics, not broader market-wide figures, so tracking long-term trends requires manual record keeping.
- Export transaction data monthly or quarterly to align with UK tax year reporting, ensuring purchase costs, postage, and refunds are properly recorded for tax purposes.
- Key KPIs such as views per impression, conversion rate, and days to sell help identify specific listing issues, but should be compared to your own historical averages rather than platform averages.
- Improving visibility often involves relisting with new photos, titles, or prices when impressions stagnate; avoid making multiple changes without tracking their impact over two weeks.
- Platform reporting to HMRC is based on sales thresholds, not automatic tax liability, with occasional sales of unwanted items generally not taxable unless exceeding the £1,000 trading allowance.
What seller metrics does Vinted show you?
Once you list an item, Vinted gives you a handful of signals at the item level. These are the numbers worth checking every time you review a listing, and they are also the numbers that most sellers either ignore or misread.
- Views: how many times the listing page was opened.
- Favourites: how many users saved the item to their wishlist.
- Impressions: how often the item appeared in search or browse results, when shown.
- Messages and offers: buyer enquiries and price negotiations tied to that listing.
- Sold status: whether the item is active, reserved or sold, with the final sale price.
Account-level summaries exist too, but they are usually limited to recent activity rather than a full history going back years. That matters if you are trying to judge long-term trends: Vinted’s interface is built for managing live listings, not for deep historical analysis.
Some things are not shown at all inside the app: net profit after your original purchase cost, postage costs you covered, or time-to-sell trends across your whole catalogue. Those need to be tracked manually, usually in a spreadsheet, alongside what the platform gives you.
How to export your Vinted data and align it with the tax year
Exporting your data is the step most sellers skip until a tax deadline forces it. Doing it regularly, rather than once a year in a panic, keeps your records usable.
- Open your profile and go to your balance or wallet section to find transaction history.
- Look for a download or export option, where available, to pull a file of recent sales.
- Check what fields are included: typically sale price, platform fee and any refunds.
- Save the export alongside your own notes on purchase cost and postage.
- Repeat this monthly or quarterly rather than waiting until the end of the year.
Platforms typically report in calendar-year blocks, 1 January to 31 December, while HMRC works in UK tax years running 6 April to 5 April. According to Gov, platforms must report seller details once you cross specific sales or income thresholds in a calendar year, though this reporting trigger does not by itself mean tax is due.
Pro Tip: Re-extract raw transaction dates from your export and filter them by 6 April to 5 April before you hand anything to an accountant or HMRC’s own tools.
Key KPIs every seller should track
A handful of calculations turn raw Vinted numbers into decisions about price, photos and timing. You do not need a data science background, just a few formulas you repeat consistently.
- Views per impression: views divided by impressions, showing whether your thumbnail and title earn clicks.
- Favourites rate: favourites divided by views, a proxy for price or desirability friction.
- Conversion rate: sales divided by views, the clearest single measure of a listing’s pull.
- Sell-through rate: items sold divided by items listed in a given period.
- Average realised price: total sale proceeds divided by number of items sold.
- Days to sell: the gap between listing date and sale date, averaged across items.
A worked example: say a jumper gets 200 views, 20 favourites and sells once.
| KPI | Formula | What it signals |
|---|---|---|
| Views per impression | views ÷ impressions | Click appeal of thumbnail and title |
| Favourites rate | favourites ÷ views | Interest without commitment, often a price signal |
| Conversion rate | sales ÷ views | Overall listing effectiveness |
| Sell-through rate | sold ÷ listed | Catalogue health over a period |
| Average realised price | proceeds ÷ items sold | Pricing accuracy against demand |
| Days to sell | sale date minus list date | Speed of turnover |
When a KPI sits well below your own average for similar items, treat it as a prompt to change one variable (photo, price or title) rather than relisting blind. Our dashboard layout examples show a few ways sellers organise these figures without building anything complicated.
Turning metrics into listing fixes
Each KPI points to a different fix, so matching the symptom to the right experiment saves time.
- If impressions are low, revisit your category choice, keywords and listing time; a mismatched category hides the item from the right search.
- If favourites are high but sales are low, test a lower price or add a short-term discount, since interest without purchase usually means price resistance.
- If views are high but conversion is low, add clearer measurements, a condition note and a realistic shipping cost, since buyers often abandon at the final details.
- Change one variable at a time, track the result for 7 to 14 days, then decide whether to keep or revert the change.
Bundling related items is worth testing when favourites cluster on similar pieces; a bundle offer can convert browsers who were on the fence about a single item. Our guide to pricing used items for resale goes into more detail on setting a starting price that still leaves room for these tests.
Pro Tip: Keep a simple log of what you changed and when, so a sales bump three weeks later can actually be traced back to the fix that caused it.
Tax and reporting: what platform data means for HMRC
Platform reporting and tax liability are separate questions, and conflating them is where most anxiety about “Vinted analytics” and tax comes from.
GOV.UK confirms that sharing sales data with HMRC is not a new tax, and selling unwanted items occasionally does not automatically create a tax bill. The trading allowance lets you earn up to £1,000 in gross trading income tax-free in a tax year; above that, HMRC guidance says you typically need to tell HMRC or register for Self Assessment.
Keep these records regardless of whether you cross any threshold:
- Original purchase cost for each item you resell.
- Sale proceeds before and after platform fees.
- Postage and packaging costs.
- Any refunds or returned items.
- A note separating calendar-year exports from your tax-year totals.
How Vinted’s algorithm uses your analytics
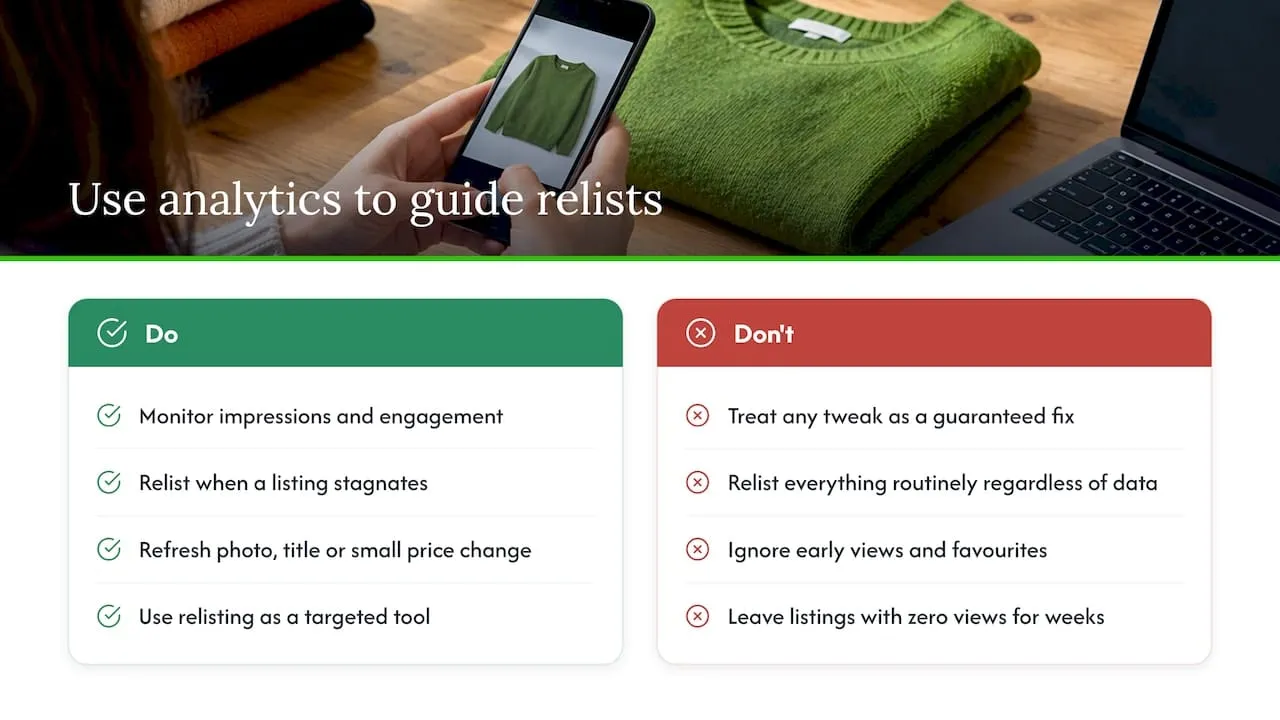
Vinted does not publish the full mechanics of how it ranks listings in search and browse results, so treat any detailed claim about exact ranking weights with caution. What is observable from seller behaviour is that activity signals, recent uploads, relistings and buyer engagement, tend to correlate with better placement, which is why many sellers relist stagnant items rather than leaving them untouched for months.
Views and favourites are not just vanity numbers in this context. A listing that earns early engagement is more likely to keep surfacing in search, while one that sits with zero views for weeks tends to fade further down the results. This is a plausible explanation based on how the visible metrics behave, not a confirmed formula, so avoid treating any single tweak as a guaranteed fix.
Practically, this means your own analytics are the best proxy you have for visibility. If impressions are flat for a listing that used to get traffic, a fresh photo, an edited title or a small price adjustment followed by a relist is a reasonable response, because it resets the recency signal without needing to understand the underlying ranking logic in detail. Treat relisting as a tool to use when data shows stagnation, not as a routine to apply to everything regardless of performance.
Benchmarking your numbers against typical seller performance
Vinted does not publish official platform-wide averages for views, conversion or days to sell, so comparing yourself to an unstated “typical seller” is guesswork dressed up as insight. The more reliable benchmark is your own history.
Track your own rolling average for each KPI, conversion rate, sell-through rate, average realised price, across a category you sell often, such as women’s knitwear or trainers. Once you have four to six weeks of your own data, new listings can be judged against that baseline rather than against a platform figure nobody can verify.
Where a external benchmark helps is in adjacent categories like general retail reporting. The idea of comparing sell-through and turnover against your own prior periods is standard practice in wider retail analytics, as laid out in this EPOS reporting guide, and the same logic transfers cleanly to resale: your past performance is the fairest yardstick you have.
Common mistakes when reading Vinted analytics
A few misreadings show up repeatedly among sellers trying to use these numbers seriously.
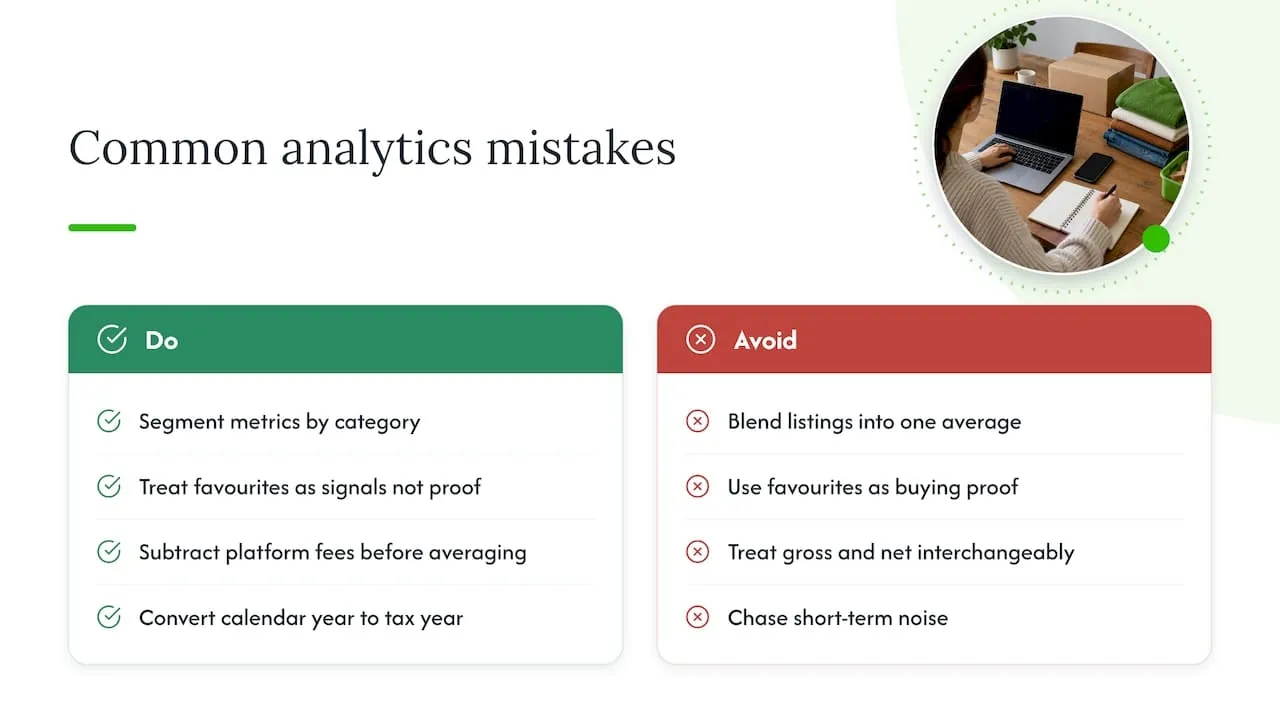
The first is treating a single listing’s numbers as representative of your whole catalogue. One slow-moving coat says little about your trainers or your handbags; metrics need to be read per category, not blended into one average that hides where the real problem sits.
The second is confusing favourites with buying intent. A high favourites count with no sales is a price or friction signal, not proof that demand exists at your asking price. Sellers who raise prices because an item is “popular” by favourites alone often watch it stall further.
The third is ignoring platform fees when calculating what a sale actually earned. The figure shown as sale price is not what lands in your pocket, and treating gross and net interchangeably distorts your average realised price over time.
The fourth is skipping the calendar-year to tax-year conversion, then assuming a platform export is tax-ready data. It is a starting point for your own bookkeeping, not a finished return.
The fifth is overreacting to short-term noise. A quiet week during a bank holiday or a surge from a seasonal trend is not a trend in your listing quality, and chasing every small fluctuation with a price change wastes the discipline that makes analytics useful in the first place.
Third-party tools that extend what Vinted shows you
Vinted’s own interface covers item-level stats well but stops short of catalogue-wide dashboards, historical trend charts or cross-marketplace comparisons. That gap is where third-party tools come in for sellers managing more than a handful of live listings.
Spreadsheet templates remain the simplest option: pulling your exports into a sheet with formulas for sell-through rate, average realised price and days to sell gives you a rolling view that the app itself does not provide. For sellers who also list on eBay, checking comparable sold prices on eBay alongside Vinted data helps sanity-check whether a slow sale is a pricing issue specific to one platform or a wider demand issue.
Beyond spreadsheets, a growing set of software aims to centralise listing management across marketplaces, which indirectly supports better analytics by keeping your sales history in one place rather than scattered across separate app interfaces. Choosing where to focus your time matters here too, and our notes on building a profitable resale business cover how to prioritise which items deserve close tracking in the first place.
Why seller-level analytics beat platform-wide stats for your business
Platform-wide figures about Vinted as a company tell you nothing about whether your navy jumper should be relisted this week. Seller-level analytics do, and that distinction is the whole point of this guide.
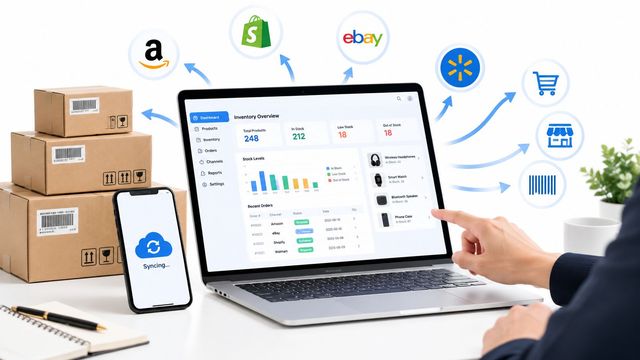
Tracking your own KPIs consistently also reduces a risk that grows as you scale: selling the same item twice across different marketplaces because stock was not updated everywhere at once. Clean, per-item data makes that kind of error far easier to catch early, and a crosslisting workflow that syncs stock automatically removes much of the manual checking that causes it.
- Luis
How Ruit helps sellers turn Vinted analytics into action
Once your Vinted metrics tell you an item is worth pushing harder, the practical bottleneck is usually managing that item across more than one marketplace without creating extra admin. With Ruit, you list an item once and publish it to Vinted, eBay, Wallapop, todocoleccion, Shopify, WooCommerce and PrestaShop at the same time. When it sells anywhere, stock updates and the listing comes down from the other channels, so a well-performing item never ends up sold twice.
Auto-relist on some marketplaces keeps stagnant stock moving without you doing it manually, one inbox consolidates buyer messages, and AI helps draft titles and descriptions to ease listing tasks. If your sales are growing and keeping track of double-sale risk across channels is starting to eat your time, it is worth seeing how Ruit works.
FAQ
What counts as Vinted analytics for a seller?
Vinted analytics refers to the seller-facing data in your own account: views, favourites, impressions and sales history for your listings. It does not include any company-wide statistics about Vinted as a business.
How do I export my Vinted sales data?
Open your balance or transaction history section in your profile and look for a download option covering recent sales. The export typically includes sale price, platform fees and any refunds, and should be saved alongside your own notes on costs.
Do I need to pay tax on Vinted sales?
Not automatically. GOV.UK confirms that occasional sales of unwanted items are not automatically taxable, though once your gross trading income passes the £1,000 trading allowance in a tax year, HMRC guidance says you typically need to tell HMRC.
Why does Vinted report my sales to HMRC?
Platforms are required to report seller details once you make at least 30 sales or receive roughly €2,000 in a calendar year, under digital platform reporting rules. This reporting trigger is separate from whether tax is actually owed.
What is a good conversion rate on Vinted?
Vinted does not publish an official average conversion rate, so the most reliable benchmark is your own rolling average by category. Comparing a new listing against your own past performance in the same category gives a fairer read than any unverified platform-wide figure.